Food Access & Vulnerable Populations
Mapping composite food access risk in Bolivar and Washington Counties, Mississippi by combining drive-time accessibility with demographic vulnerability.
Summary
This capstone analyzes how poverty, income, age 65+, and vehicle access intersect with physical access to food outlets in Bolivar and Washington Counties, Mississippi. Using GIS, the project maps food outlets, 10- and 15-minute drive-time service areas, and American Community Survey indicators to identify census tracts where social vulnerability and geographic isolation overlap.
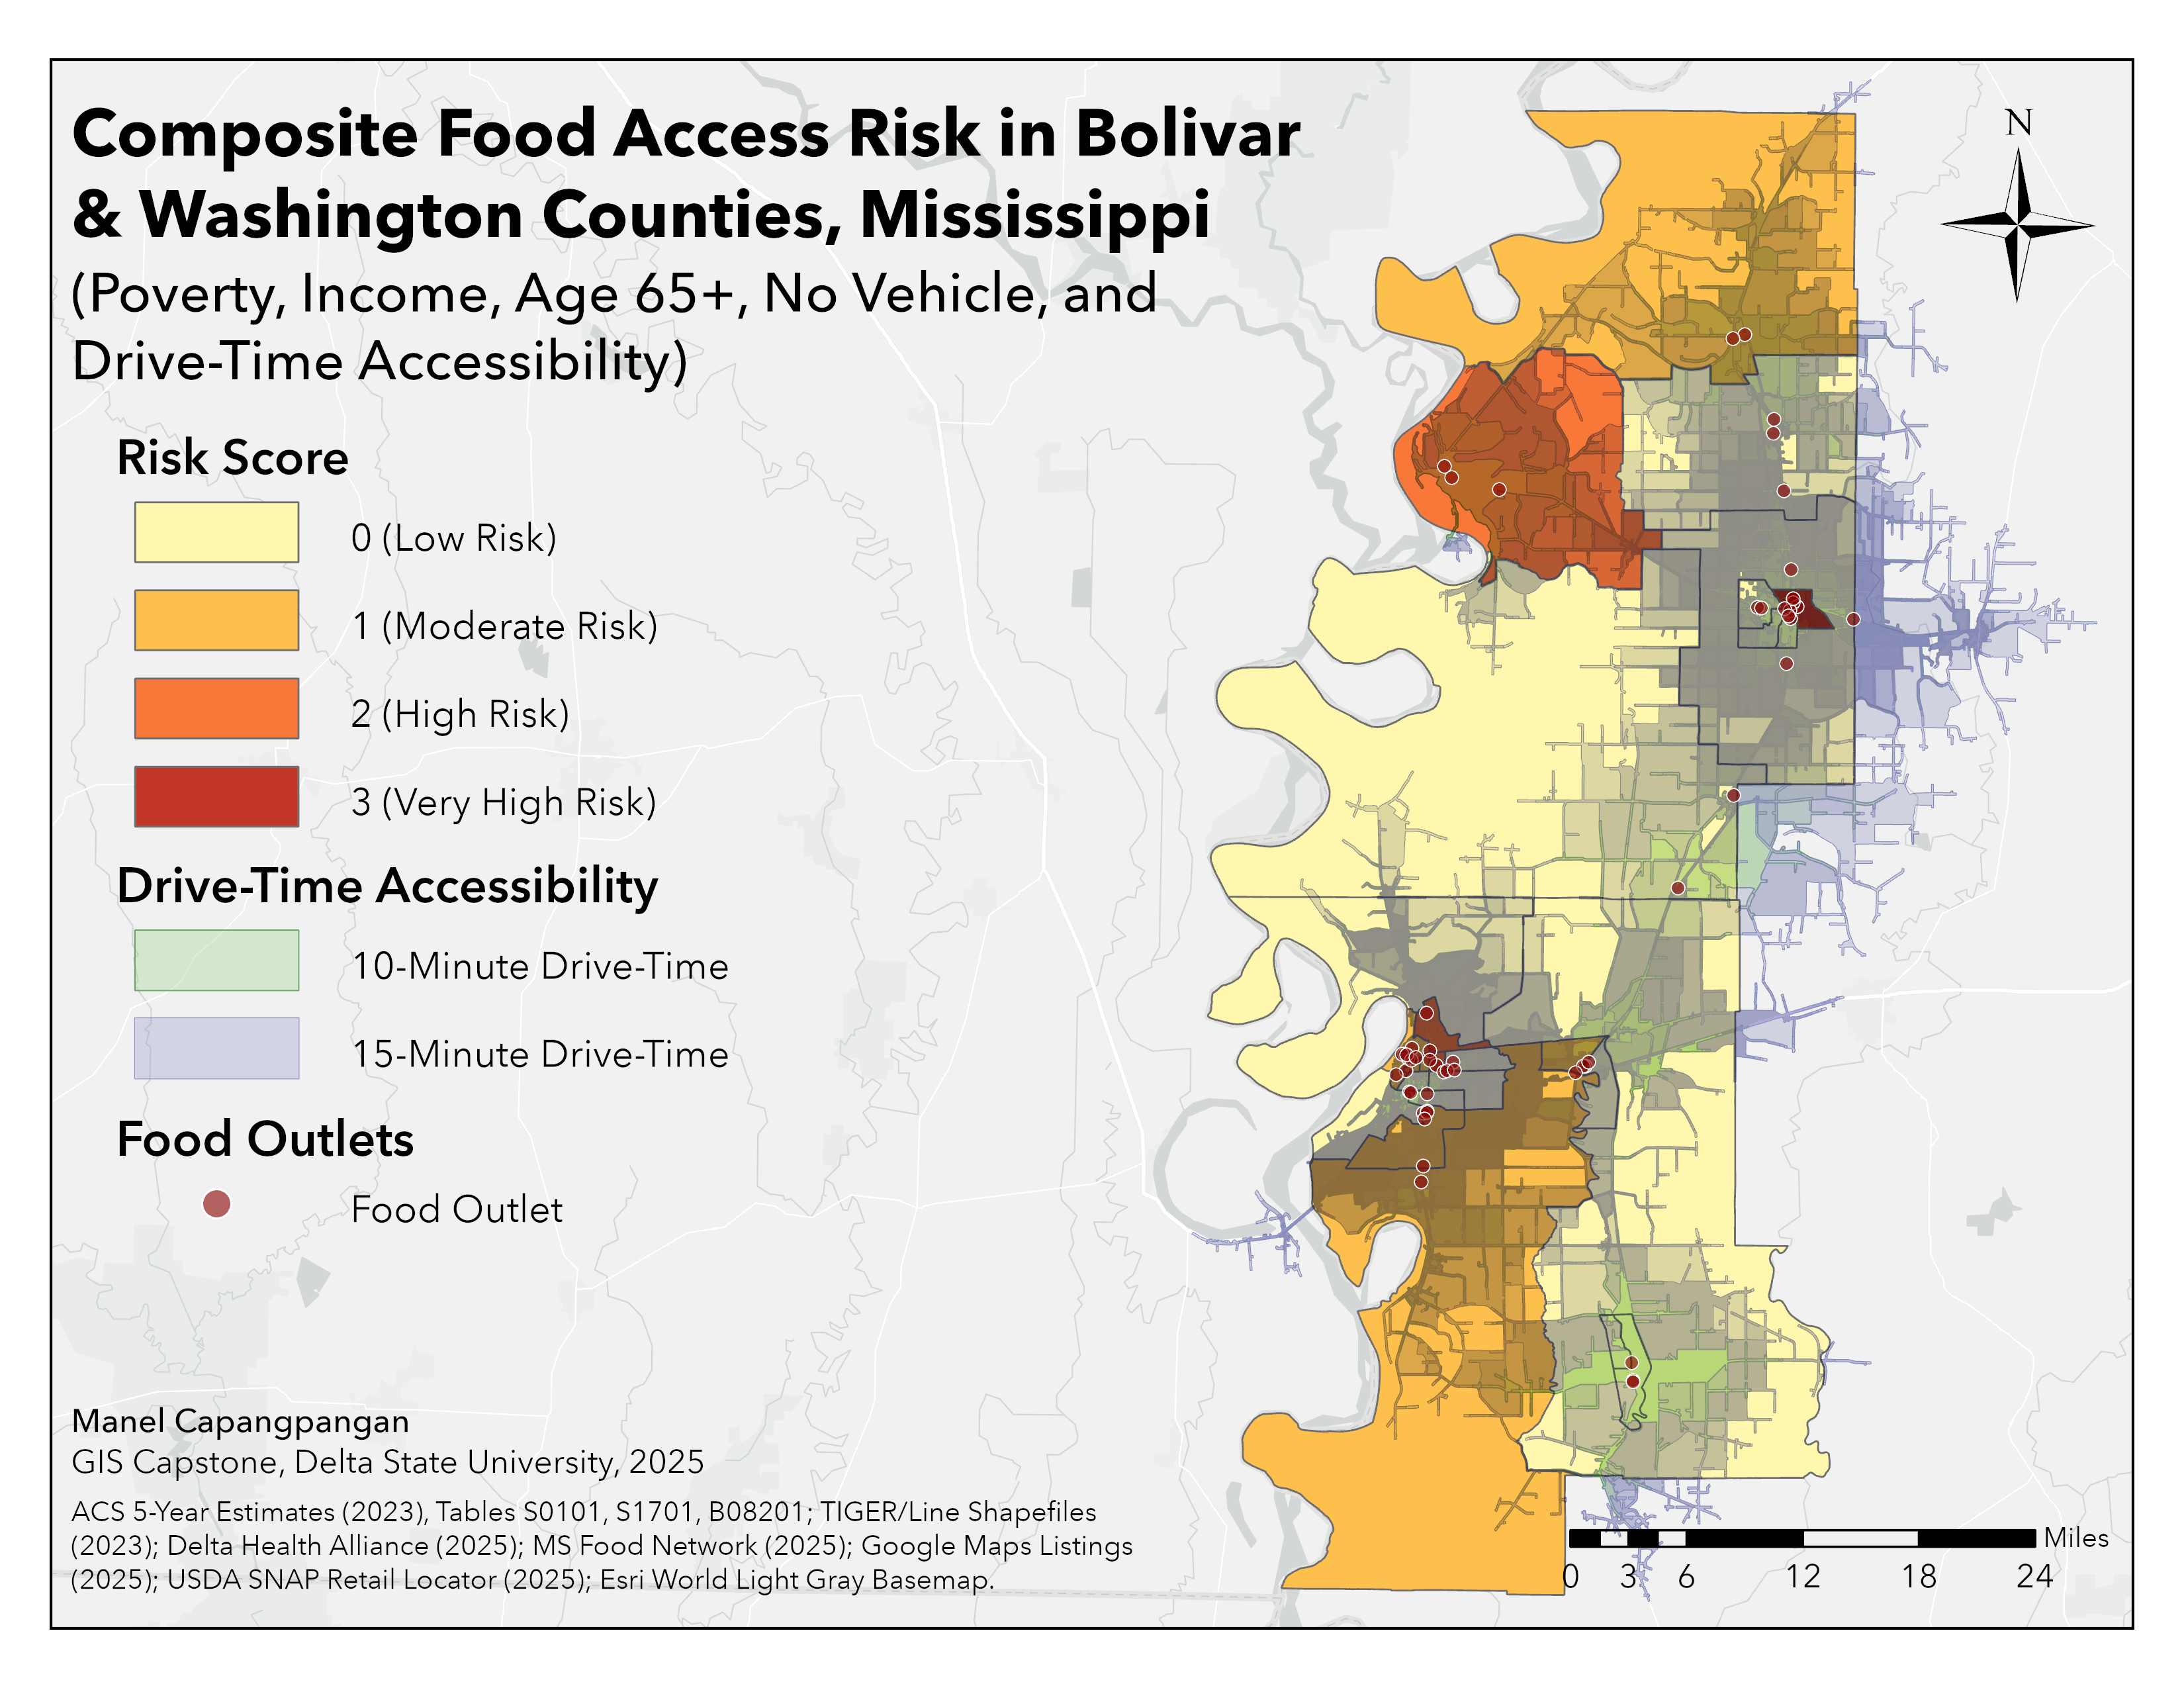
A composite RiskScore (0–3) is assigned to each tract based on four high-risk conditions: high poverty, low median income, a large share of older adults, and households without a vehicle. The final outputs include a six-map PDF series and an ArcGIS Experience Builder app designed to support local organizations, researchers, and policymakers working to improve food access in the Mississippi Delta.
Objective
To identify census tracts in Bolivar and Washington Counties where demographic vulnerability (poverty, low income, aging populations, and limited vehicle access) overlaps with limited drive-time access to food outlets, and to summarize this information in a composite food access RiskScore that can guide local decision making.
Data
-
Datasets:
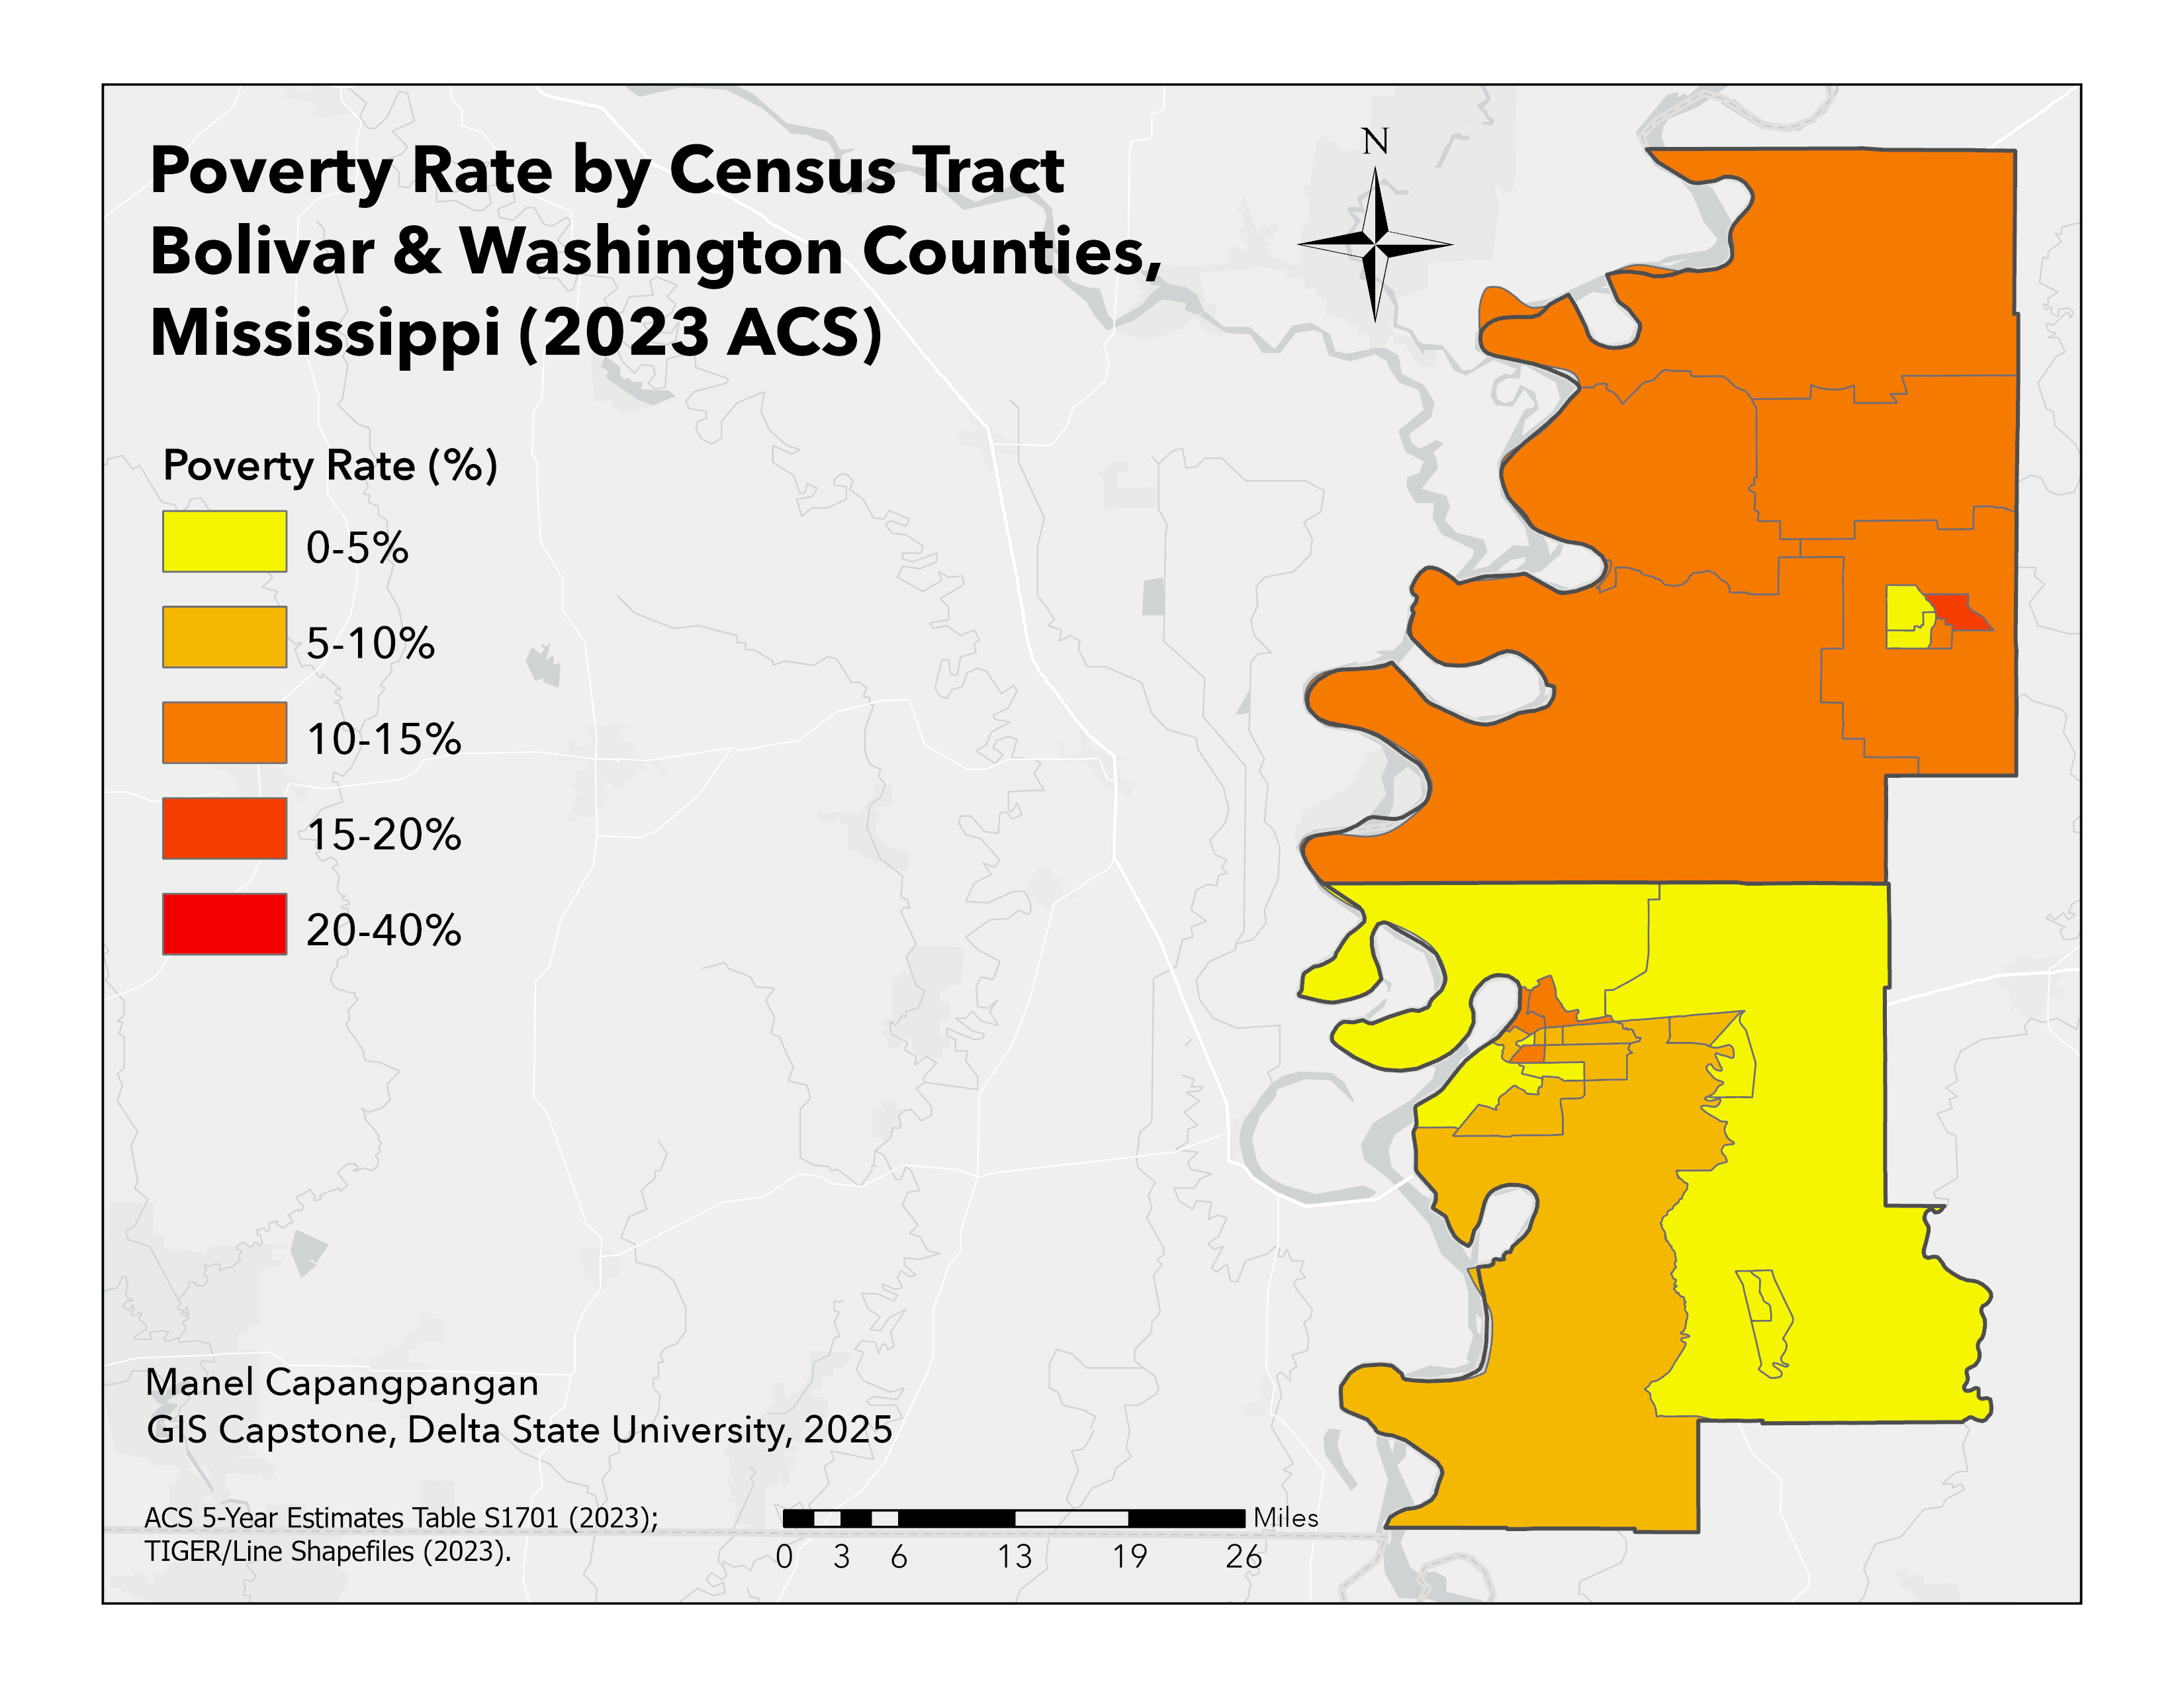
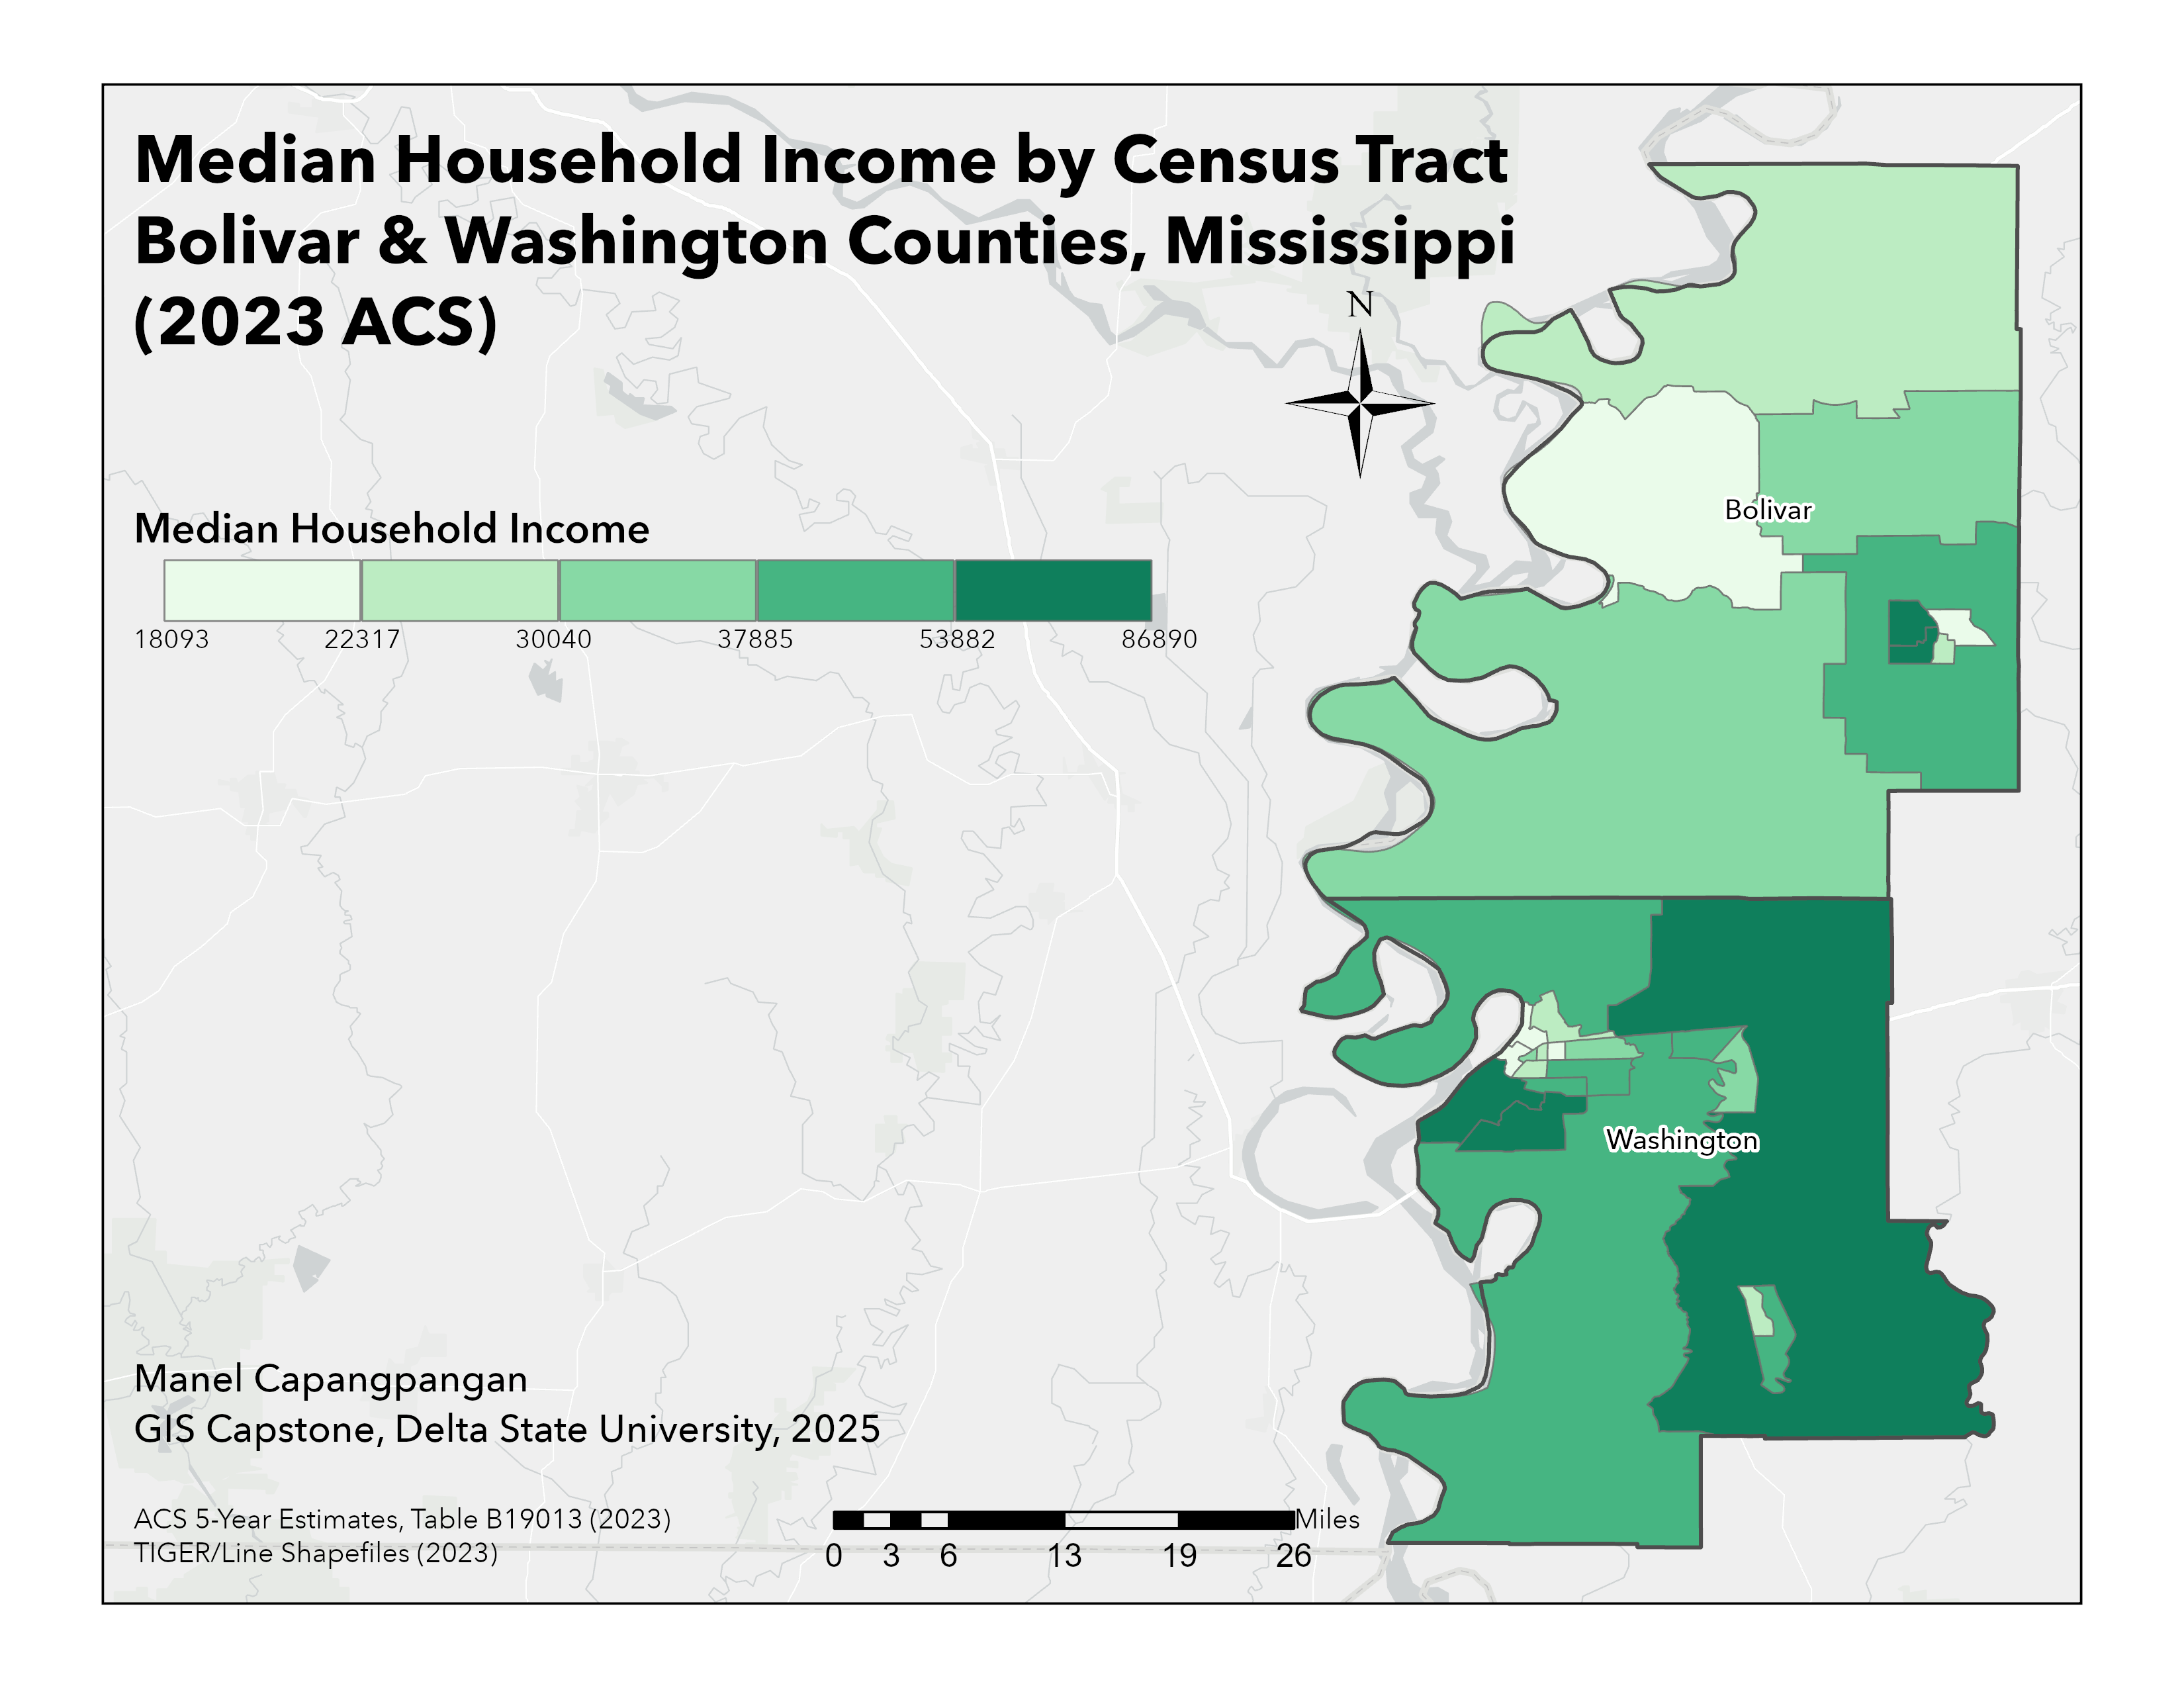
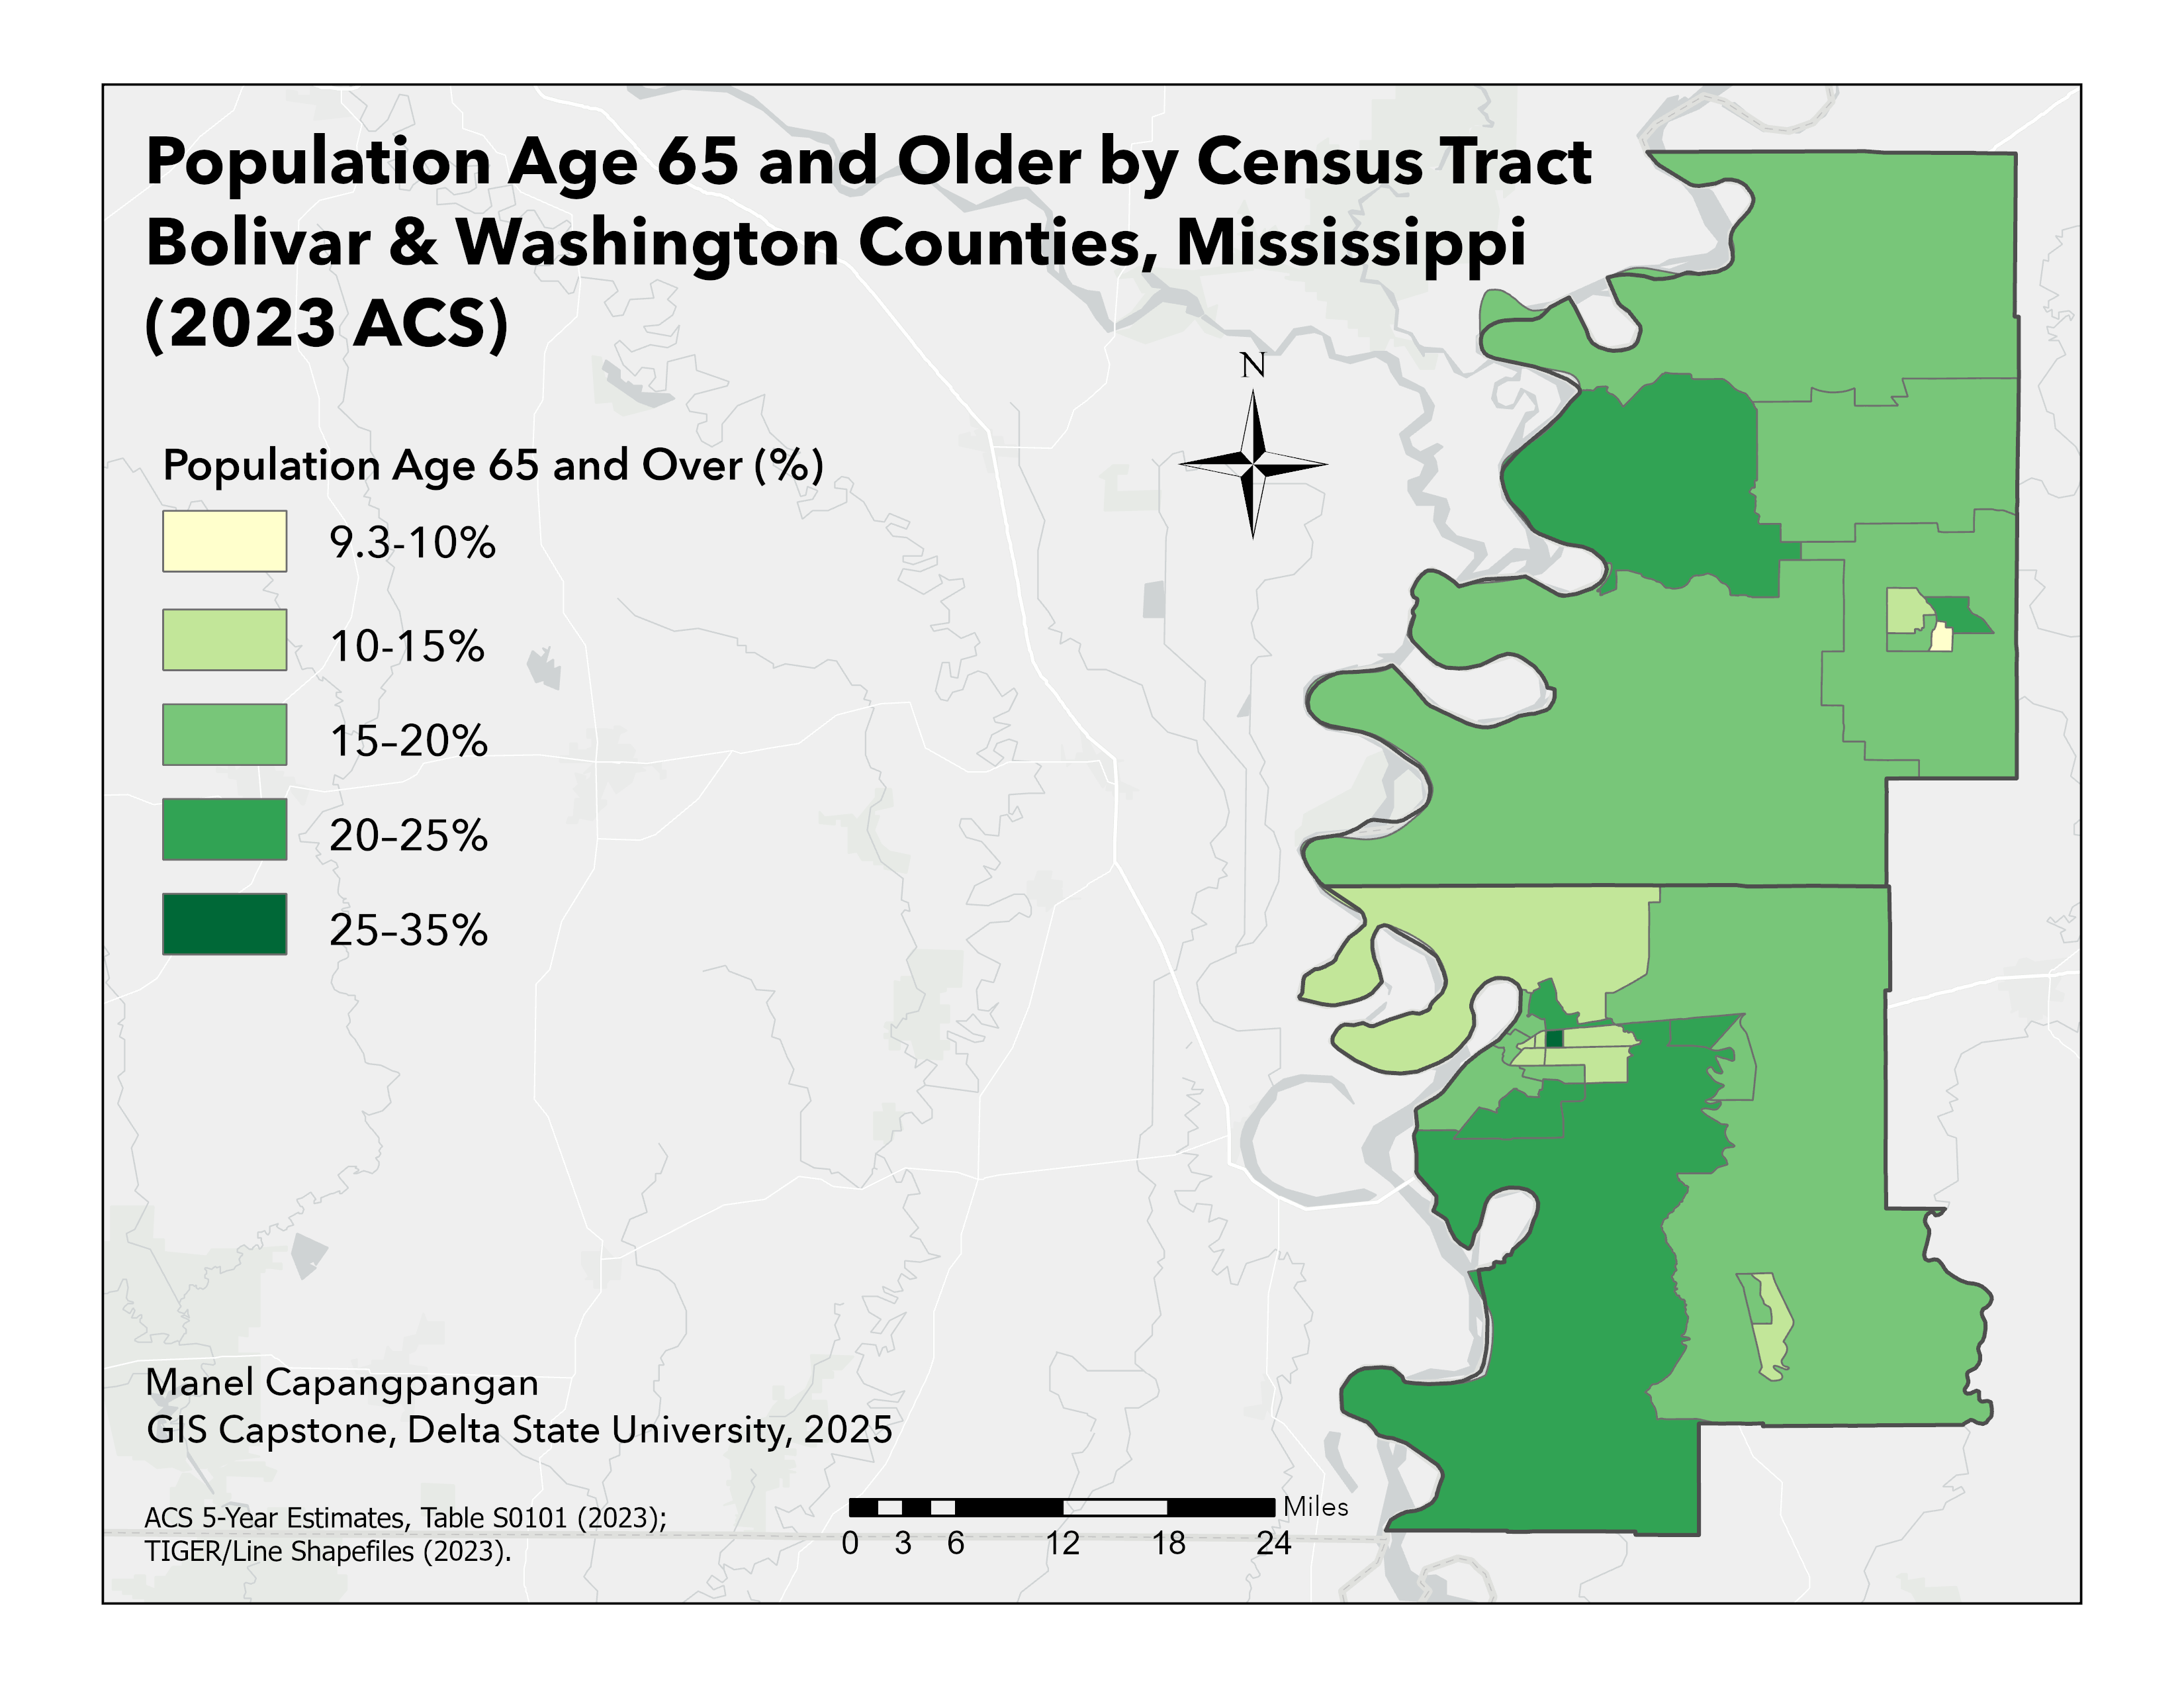
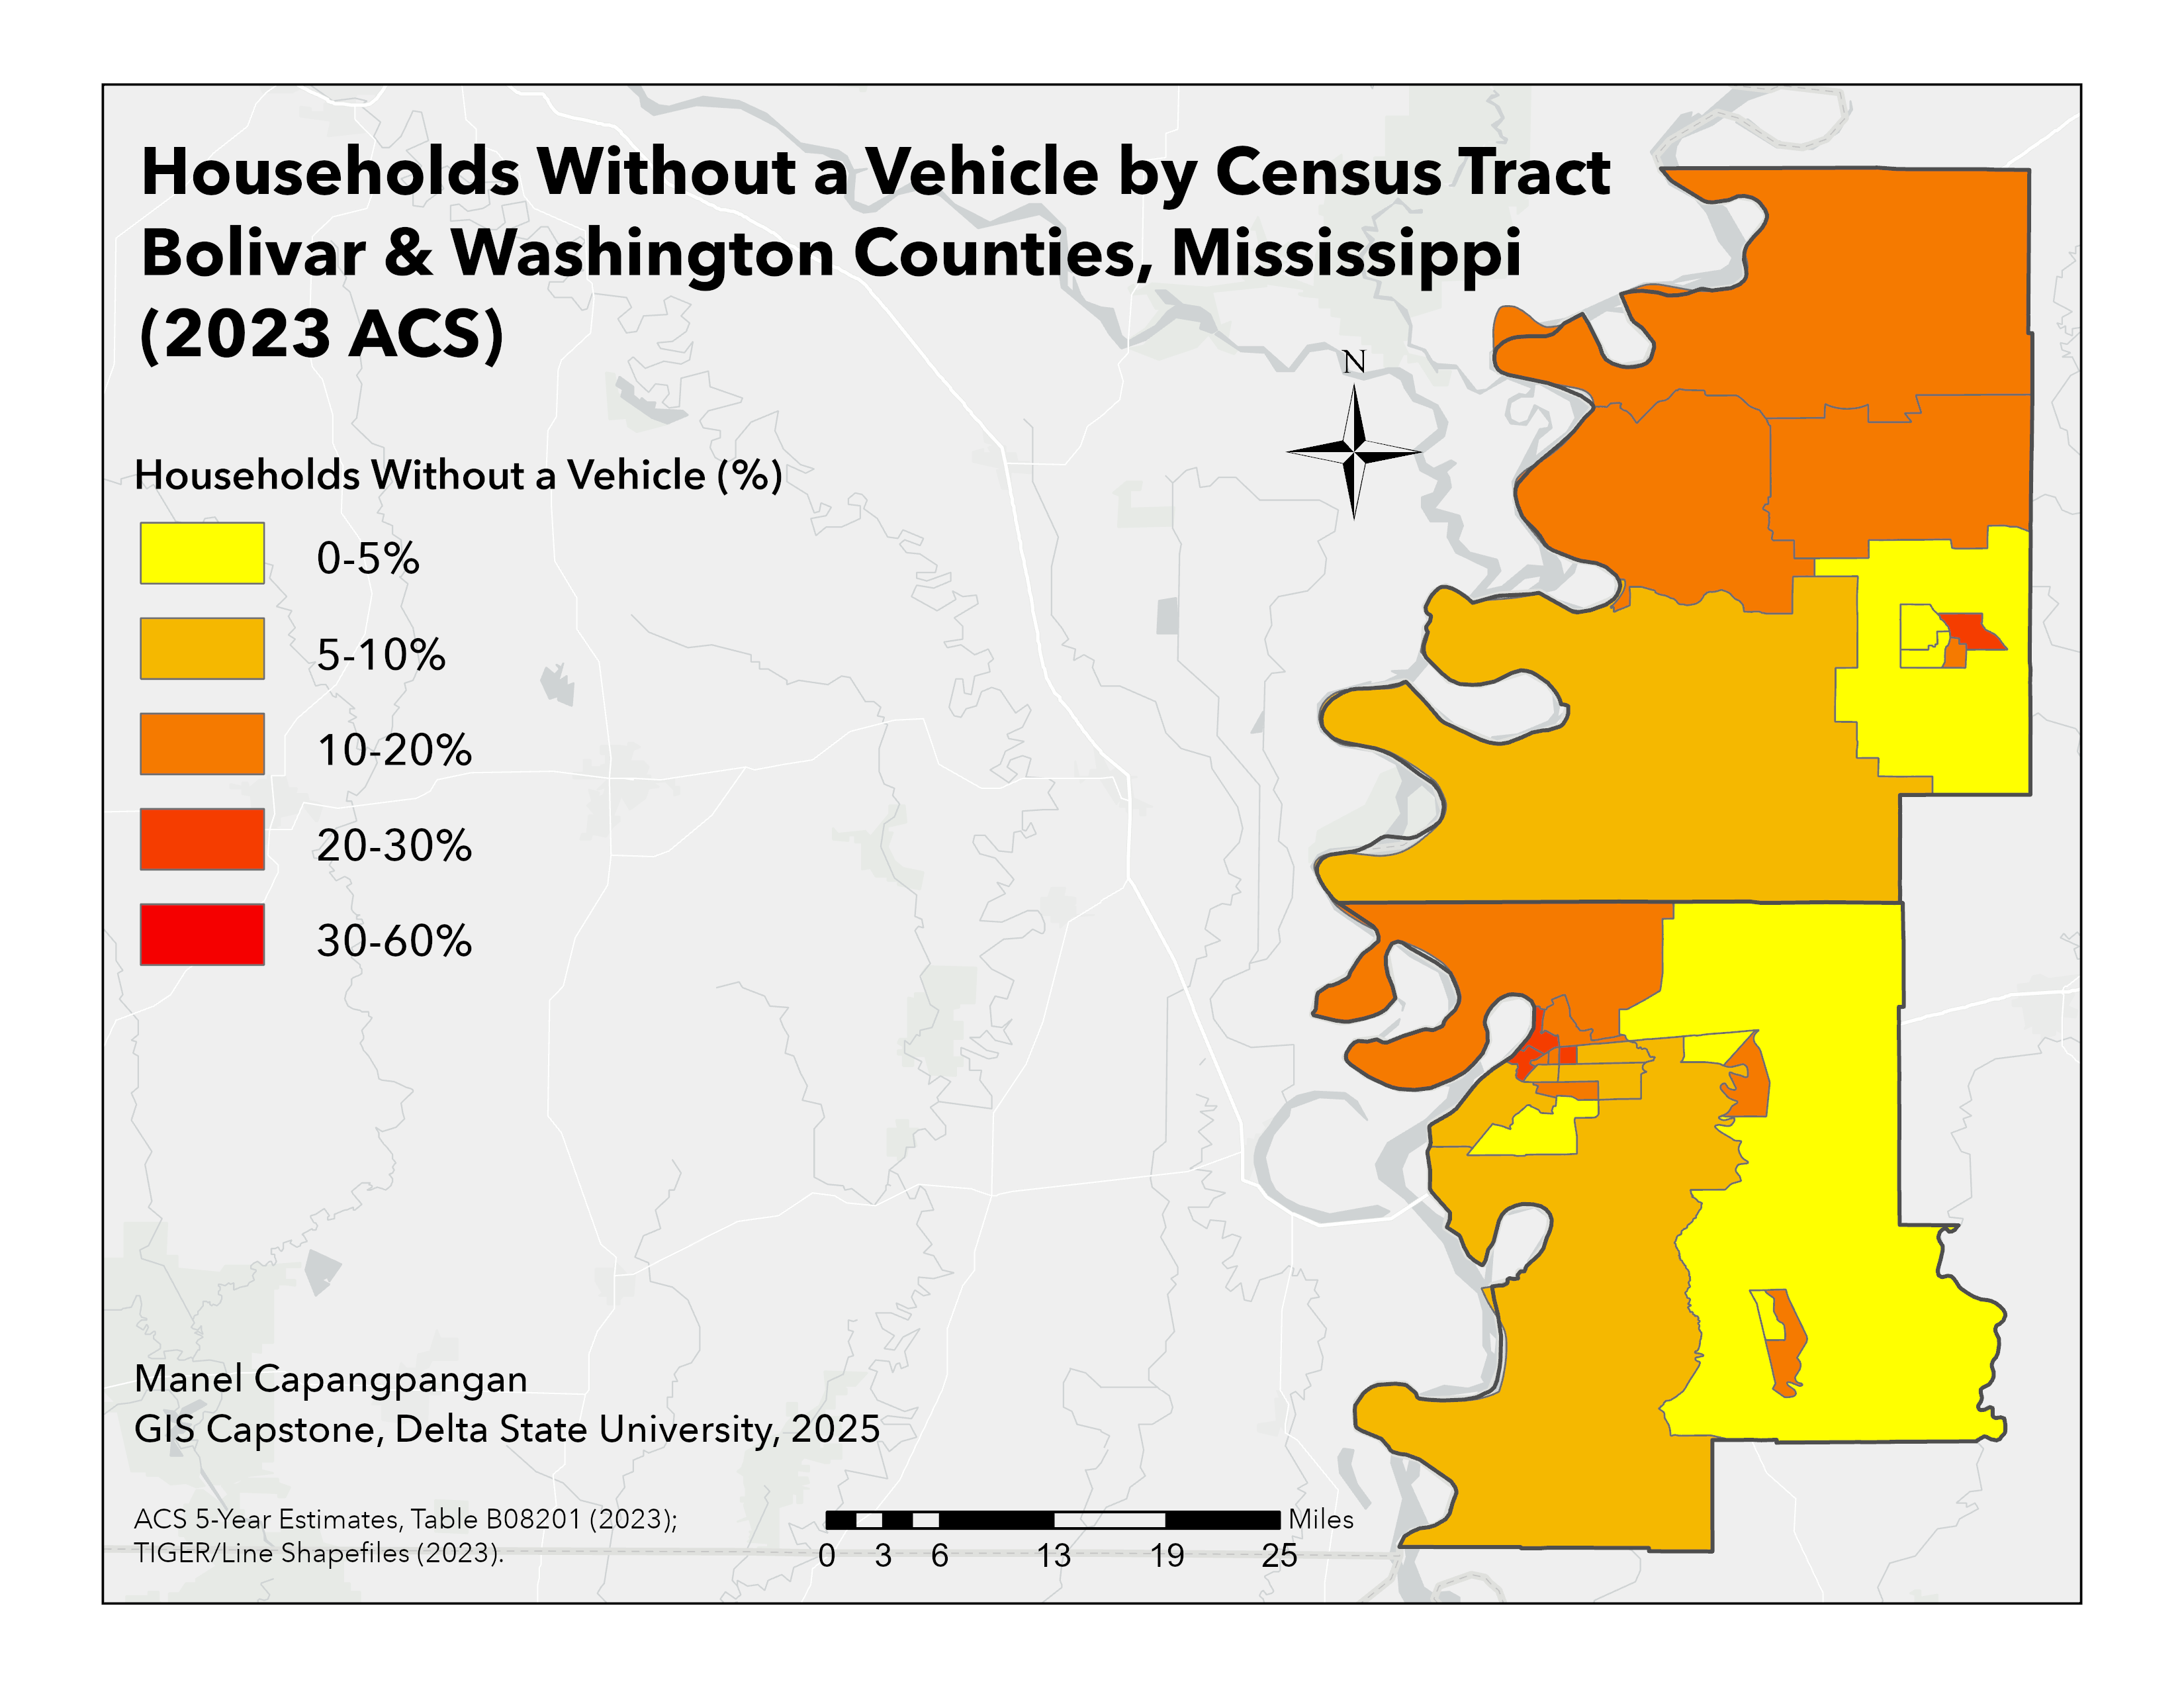
- American Community Survey 2023 5-Year Estimates: Poverty (S1701), Median Household Income (B19013), Population Age 65+ (S0101), Households Without a Vehicle (B08201).
- Food outlets from Delta Health Alliance, Mississippi Food Network, Google Maps business listings, and USDA SNAP Retailer Locator.
- TIGER/Line census tract and road shapefiles, Esri World Light Gray basemap.
- Spatial extent: Bolivar and Washington Counties in the Mississippi Delta, USA.
- Time frame: Demographic data centered on 2019–2023 ACS; food outlet sources updated in 2025.
Method
- Data collection & cleaning. Compiled food outlet lists from multiple sources, removed duplicates, standardized store types, and geocoded all locations in ArcGIS Pro. Joined ACS 5-year estimates to census tracts.
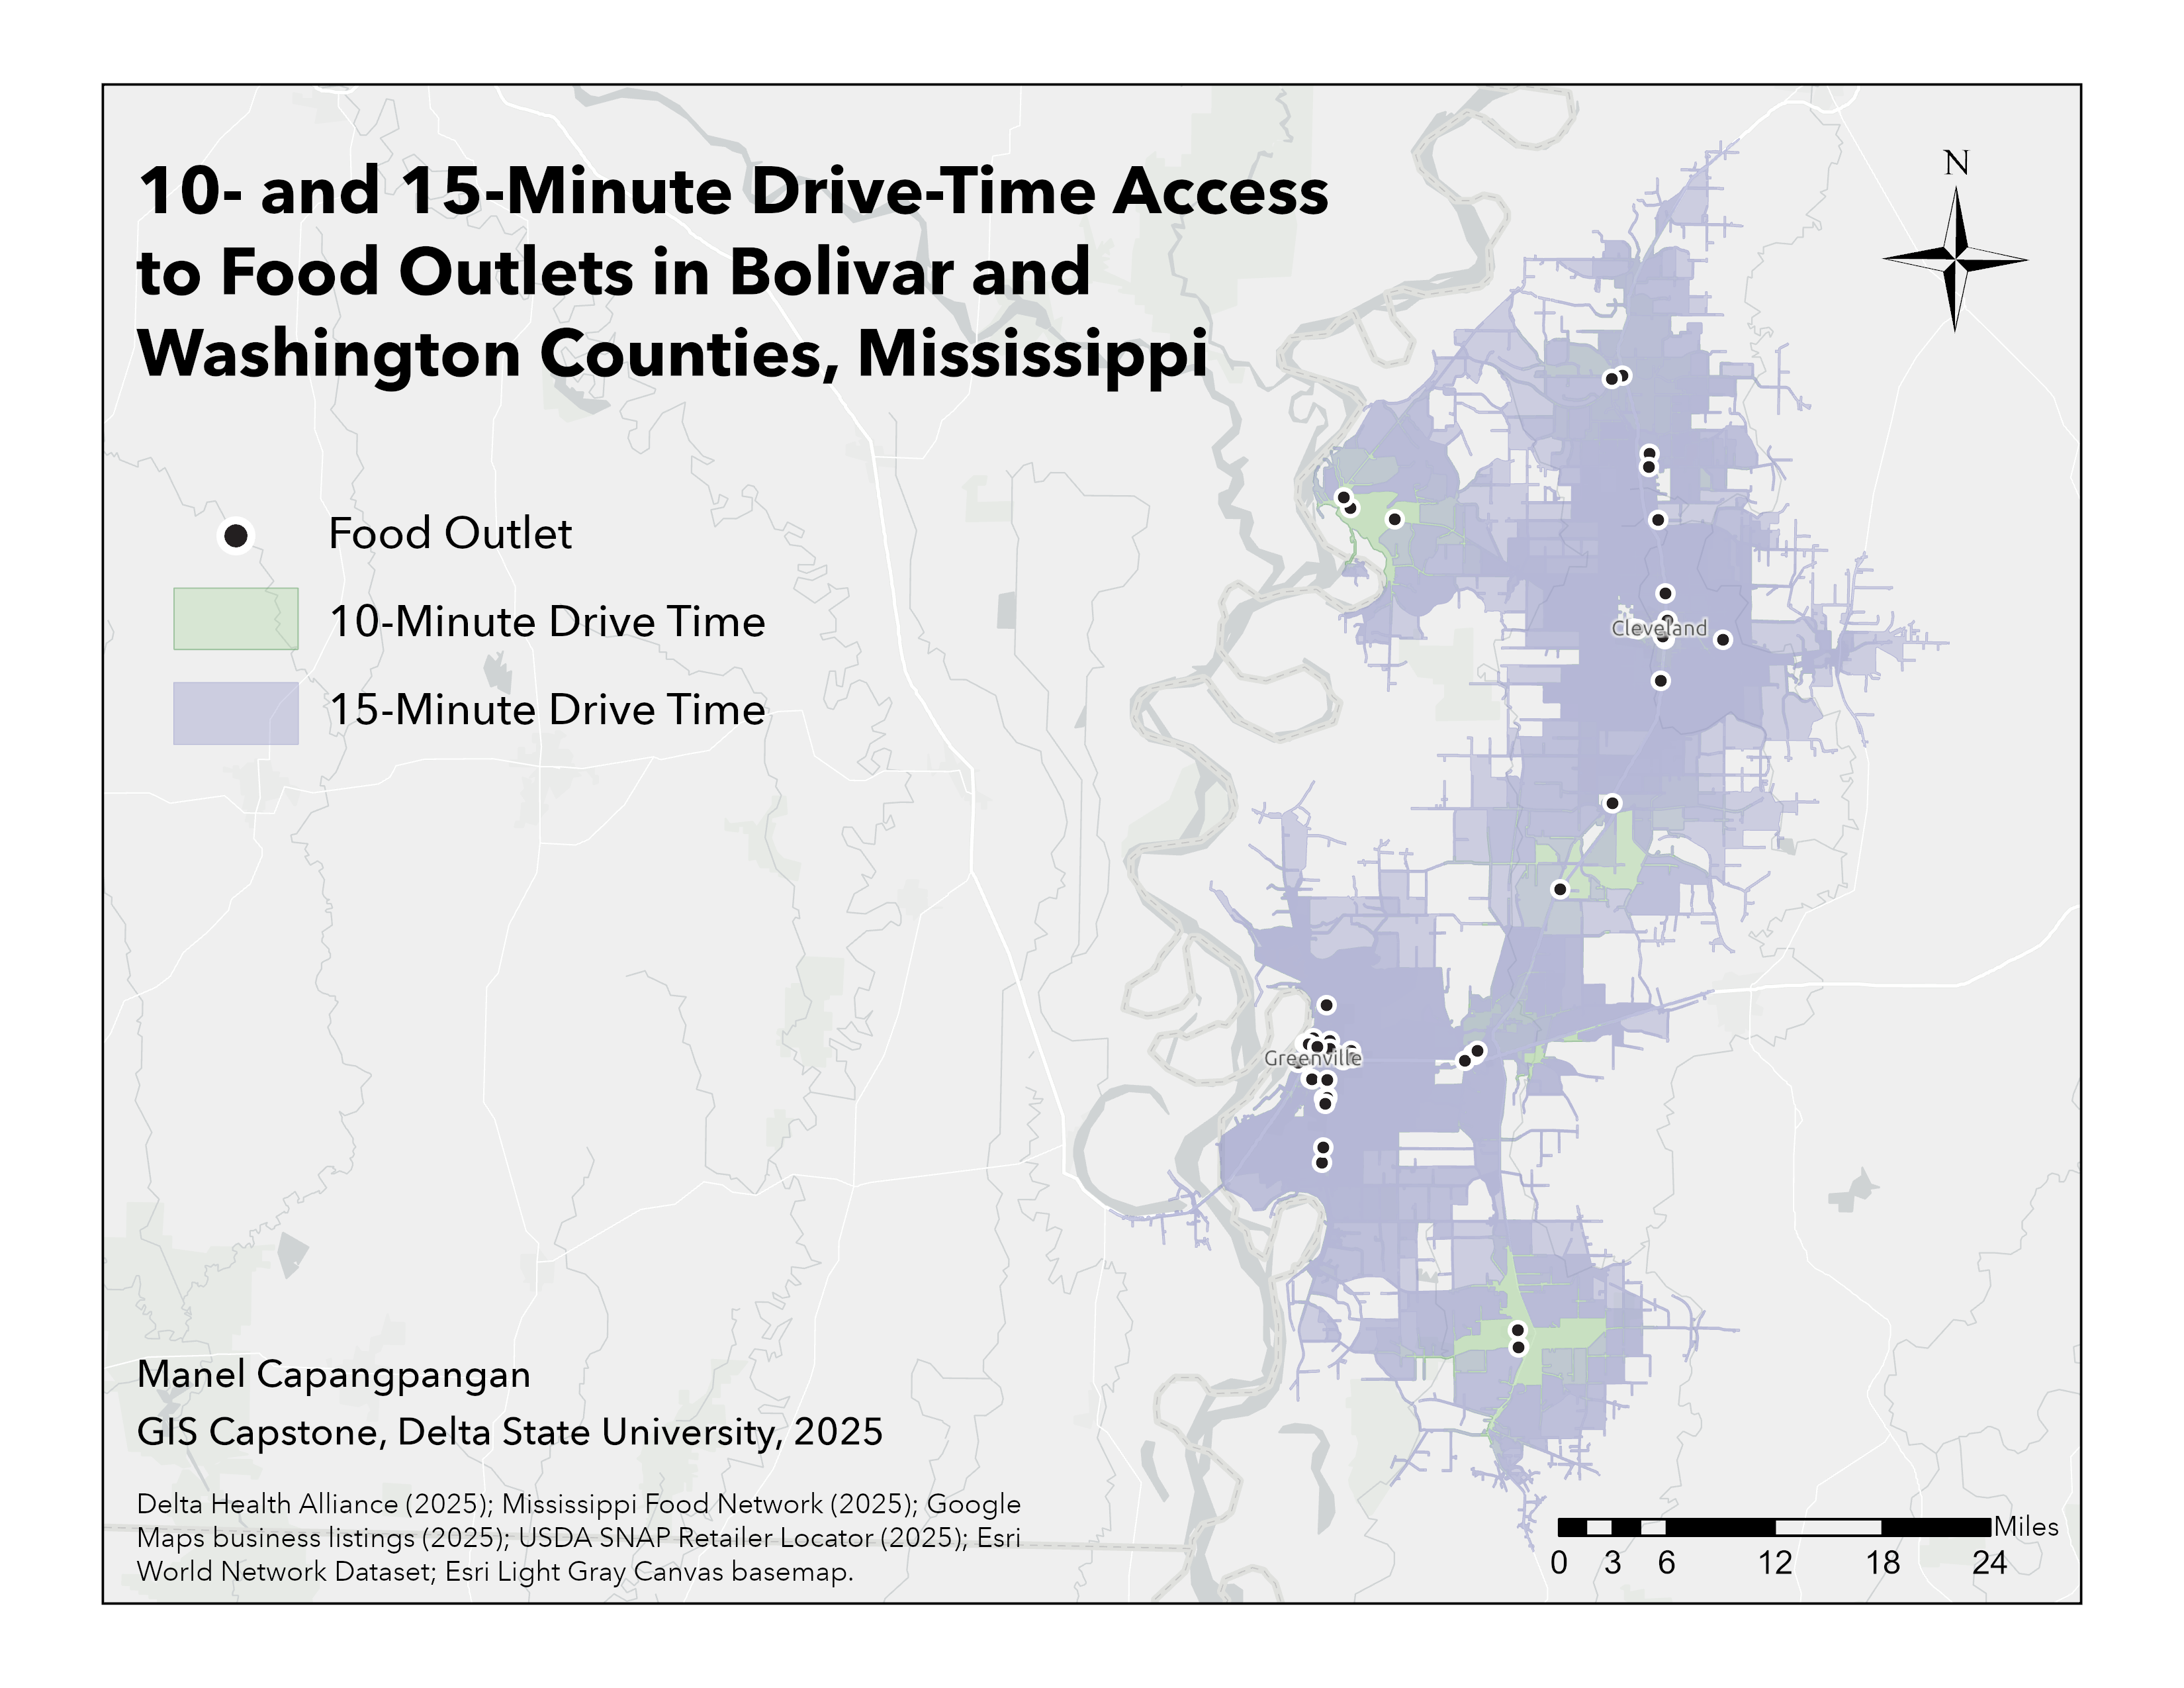
- Drive-time accessibility. Used ArcGIS Network Analyst to generate 10-minute (green) and 15-minute (purple) service area polygons around all food outlets using local road networks.
- Demographic vulnerability & RiskScore. Mapped four indicators (poverty, median income, age 65+, no vehicle) with fixed class breaks. Assigned 1 point for each high-risk condition: poverty ≥ 20%, income ≤ county median, age 65+ ≥ 20%, no vehicle ≥ 10%. Aggregated to a composite RiskScore from 0–3 for each tract.
- Cartography & Experience Builder. Designed six standardized map layouts (one per indicator plus drive-time and composite map). Published layers to ArcGIS Online and built an Experience Builder app so users can explore risk tracts, toggle layers, and view tract-level pop-ups.
Gallery